
Let's be honest. Your recruitment dashboard is probably a graveyard of vanity metrics. You're tracking things like 'applicants per opening' and 'time to fill,' but you have no real idea if you're hiring the right people.
This isn't a lecture; it's an intervention. I've been there, chasing numbers that looked fantastic in a slide deck but did absolutely nothing to predict who would actually thrive in a role. It’s easy to get lost in the noise, especially when your HR software promises a million different charts and graphs. But more data isn't always better data.
Recruitment KPIs (Key Performance Indicators) are the handful of critical numbers that tell you if your hiring process is actually working. They move you beyond guesswork, showing you what’s effective and what’s just burning through your budget without mortgaging your office ping-pong table.
The most important KPIs boil down to four things: hiring speed, cost, source effectiveness, and the holy grail—the quality of the new hire.
Why Your Recruitment Metrics Are Broken
The fundamental problem is that most old-school metrics track activity, not impact. A flood of applications feels productive, right? But it usually just means your job description is too vague, attracting a crowd of unqualified candidates. Hope you enjoy spending your afternoons fact-checking resumes—because that just became your full-time job.
The goal isn’t to be busy; it’s to be effective. A successful recruitment process doesn’t just fill a seat quickly. It fills a seat with someone who drives the business forward, stays long-term, and makes the team better.
Think about the metrics you see plastered everywhere:
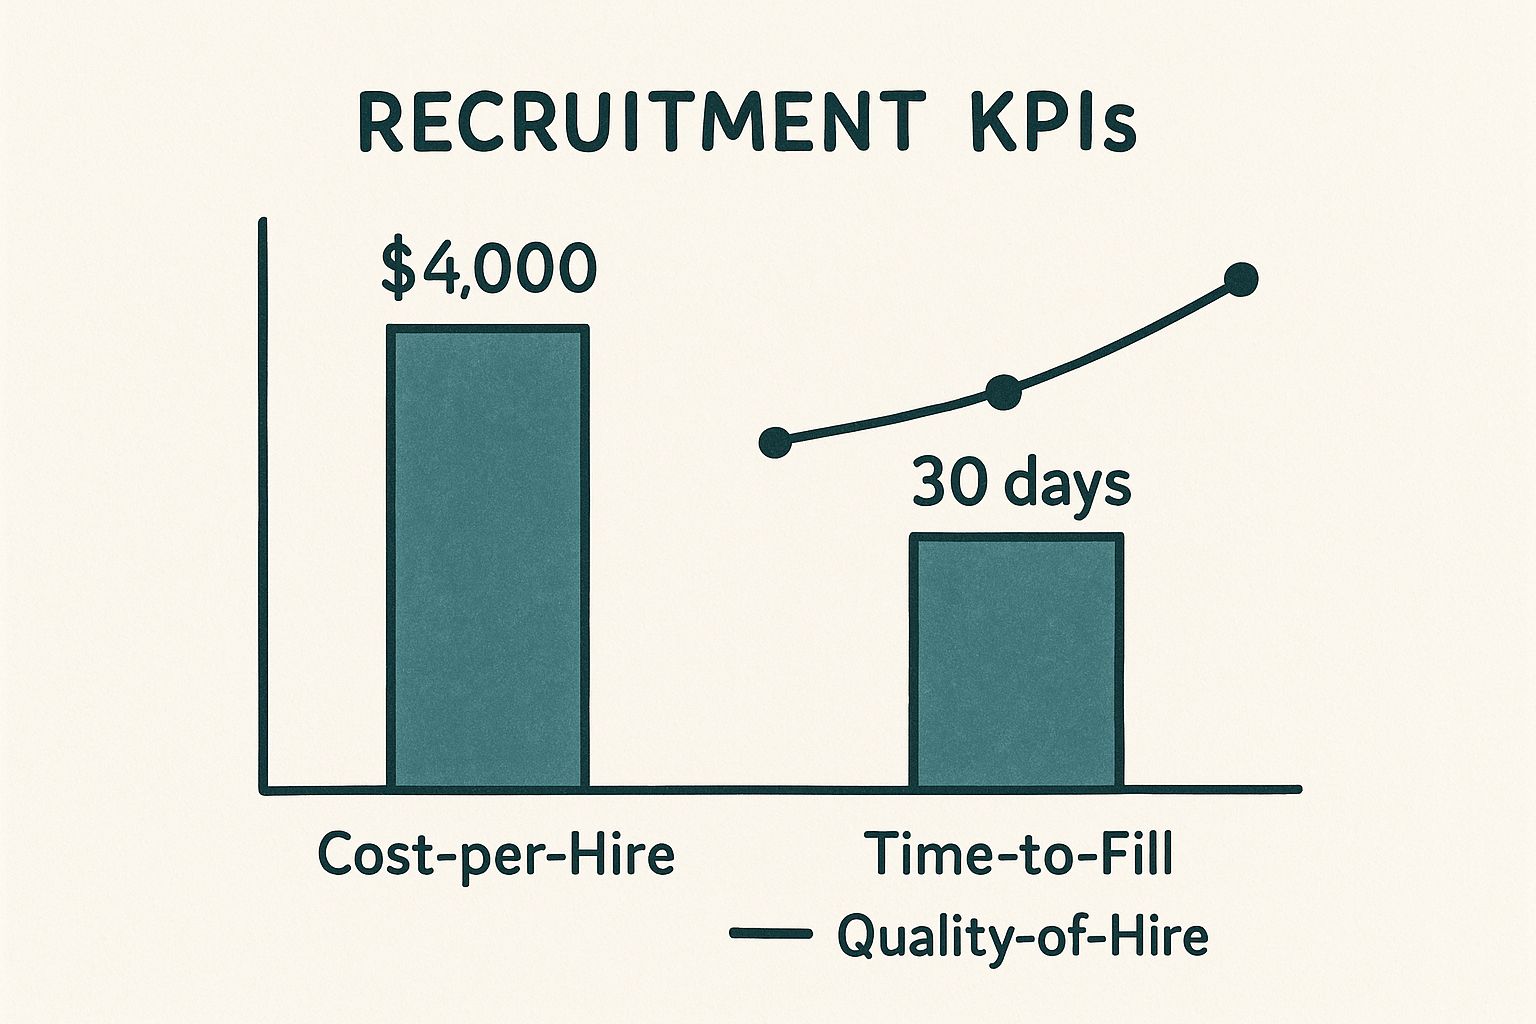
This kind of dashboard tells a familiar story. The cost and time seem reasonable, but the ultimate goal—achieving a perfect 10/10 Quality of Hire—still feels out of reach. That's the gap we need to close.
So, how do we fix this? It starts with a simple swap: trading feel-good numbers for metrics that force tough, strategic conversations.
Vanity Metrics vs. Actionable KPIs
| The Vanity Metric You're Probably Chasing | The Actionable KPI You Should Track Instead | Why This Shift Changes Everything |
|---|---|---|
| Time to Fill | Time to Productivity | It stops rewarding recruiters for filling seats quickly and starts rewarding them for finding candidates who ramp up and add value fast. |
| Applicants per Opening | Qualified Candidates per Source | This tells you which channels are actually delivering talent, not just sending a tidal wave of resumes your way. You can reallocate budget with confidence. |
| Cost per Hire | New Hire Performance at 90 Days | A low cost-per-hire is meaningless if the person quits or underperforms. This KPI directly links your hiring process to business outcomes. |
Switching your focus from vanity metrics to actionable KPIs is the first real step toward building a hiring machine that doesn’t just run, but wins. It helps you ask better questions and find real answers. And to truly get to the root of the problem, you have to look at how decisions are made in the first place, which is where strategies like reducing hiring bias with AI tools can make a fundamental difference.
Forget everything you think you know about hiring metrics. We’re starting over with what actually works.
The Foundational Metrics: Time and Cost

Alright, let's get serious. If you're not measuring speed and cost in your hiring, you aren't running a business function; you're running an expensive hobby. Forget the fluffy stuff for a second. The two KPIs that form the absolute bedrock of any sane recruitment strategy are Time to Hire and Cost Per Hire.
Everything else builds on these two. Get them wrong, and you’re just lighting money on fire while your best candidates accept offers from your competitors.
The $500 Hello
First up, Cost Per Hire (CPH). This isn’t just about the recruiter's salary or the invoice from a job board. That's amateur hour. Your real CPH is the sum of every single dollar—and hour—that goes into filling a single role.
Think of it like this:
- External Costs: These are the easy ones to spot. Job board postings, agency fees (often the big one), background check services, and assessment tools all fall here.
- Internal Costs: This is where the real money drains away. We're talking about the salaries of your recruitment team, the hours your hiring managers spend in interviews instead of doing their actual jobs, and even the time your engineers spend running technical screens.
That last one is a killer. Every hour a senior developer spends interviewing a mediocre candidate is an hour they’re not shipping product. That cost adds up faster than you can say "missed deadline." You need to tally up all these costs and divide them by the number of hires you made in that period. Simple, but brutally honest.
Tracking CPH forces you to justify your spending. And one of the best ways to get this number down is to get faster and smarter. Companies using AI-powered assessments have reported 46% faster hiring cycles, which directly slashes these hidden costs. It’s no surprise that 85% of HR pros see data analytics as essential for the future of recruitment.
Your Best Candidates Have a Short Shelf Life
Next, let's talk about Time to Hire. This metric measures the number of days from when a candidate first applies to the day they accept your offer. Notice I said "applies," not when the job was posted. Why the distinction? Because this measures the candidate experience, which is what actually matters.
A long Time to Hire is a silent killer.
We’ve all been there. You find the perfect candidate. They ace the interviews. The team loves them. Then you spend two weeks getting internal approvals, and by the time you finally make an offer, they’ve already accepted another one. Game over.
Top talent isn't sitting around waiting for you to get your act together. The best candidates are off the market in just 10 days. If your process drags on for a month, you're not even in the game—you're just interviewing the people your competitors already passed on. A slow hiring process is a sign of disrespect; it tells candidates you don't value their time.
Tying It All Together
These two metrics are two sides of the same coin. A slow, inefficient process doesn't just annoy candidates; it inflates your Cost Per Hire. You rack up more manager hours, more administrative back-and-forth, and more lost productivity from an empty seat.
Conversely, a fast process isn't just about speed. It's about decisiveness. It signals to the market that you know what you want and you respect talent enough to move quickly. For a deeper dive into practical strategies, check out our guide on how to reduce Time to Hire without sacrificing quality.
Start by tracking these two numbers religiously. Calculate your CPH every quarter and your Time to Hire for every single role. Once you have a baseline, you can start asking the right questions. Why did it cost $15,000 to hire that junior marketer? Why did it take 45 days to get an offer out to our top engineering pick?
These aren't just numbers on a dashboard. They are the vital signs of your recruitment machine.
Measuring What Truly Matters: Quality of Hire

This is it. The holy grail. The one KPI everyone talks about but then dismisses as too “soft” or “impossible” to track. I’m here to tell you that’s a lazy excuse.
Quality of Hire is, without a doubt, the single most important metric on your recruiting dashboard. Think of it as the final exam for your entire hiring process. A low Cost Per Hire and a lightning-fast Time to Hire are completely meaningless if the person you bring on board quits or gets fired in six months. All you’ve done is efficiently hire the wrong person. Congratulations.
The truth is, Quality of Hire isn't some mystical, unquantifiable concept. It’s about answering one simple question: Did we make a good hire? You can—and absolutely must—turn this into a hard number that proves your team's value to the C-suite.
Turning "Gut Feel" into Cold, Hard Data
Let's kill the idea that this is all subjective. You can create a simple, pragmatic Quality of Hire score by combining a few key data points. No data science degree required, I promise.
Think of it as a scorecard for your new hire after their first six to twelve months on the job. Here’s a stripped-down, no-fluff formula that actually works:
- (Performance Score / 5) + (Retention Rate) + (Manager Satisfaction / 5)
Let's quickly break that down. The Performance Score comes directly from their first formal performance review. Retention Rate is binary—did they stick around for the first year? (Yes = 1, No = 0). And Manager Satisfaction is a quick survey you send to the hiring manager.
This isn’t about achieving perfection. It’s about establishing a consistent benchmark. Is a new hire who scores a 2.8 out of 3 a better addition than one who scores a 1.5? Absolutely. Now you’re not just guessing; you’re measuring.
The Three Pillars of a Great Hire
To make this formula truly powerful, you need to be disciplined about how you gather the data. It really comes down to three core components that, when combined, paint a shockingly accurate picture of a new employee's long-term value.
1. Performance Review Scores
This is the most objective piece of the puzzle. At the six-month or one-year mark, what was the new hire's official performance rating? A top performer is a top performer. This metric directly links your hiring efforts to tangible business output.
2. Ramp-Up Time
How long did it take for this person to become a fully productive member of the team? This is a crucial indicator. A great hire might take just 30 days to get up to speed, while a poor fit could still be struggling after 90 days, draining their manager's time and energy.
3. Manager Satisfaction
This is where you get the "on-the-ground" feedback. Send a short, non-annoying survey to the hiring manager at the 90-day mark. Ask them to rate the new hire on a scale of 1-5 on things like cultural fit, skill alignment, and overall contribution.
The Big Takeaway: Stop treating Quality of Hire like an abstract art project. It’s a simple calculation. By combining performance data, ramp-up speed, and manager feedback, you create a tangible score that proves the ROI of your recruiting function.
Getting Managers to Actually Play Along
I can hear the groans already. "Another survey? My managers are too busy." Of course they are. That's precisely why you don't pitch this as another piece of HR admin. You pitch it as a tool that makes their lives easier.
Frame the conversation like this: "Help me understand what a great hire looks like for your team, and I can bring you more of them and fewer of the ones that drive you crazy." See the difference? You’re not asking them to do paperwork; you’re asking for their expert input to solve their biggest problem: building a winning team.
Keep the survey brutally simple—three to five questions, max. Make it a rating scale they can complete in 60 seconds. When they see that their feedback directly leads to better candidates in the next hiring round, they’ll become your biggest advocates. You’re not just tracking KPIs for recruitment; you’re building a feedback loop that makes the entire company smarter about talent.
Fixing Your Leaky Sourcing Funnel

Let’s talk about your sourcing funnel. Yes, it’s a funnel, and I guarantee it’s leaking cash, talent, and your team’s sanity. Every stage, from the moment a candidate sees your job post to the day they sign an offer, has cracks where your best people are slipping away.
Your job isn’t just to pour more candidates into the top; it’s to plug the leaks. The good news is that a few specific KPIs for recruitment act like a smoke test, showing you exactly where the problems are. This is about making sure top talent flows smoothly from 'Applied' to 'Hired,' not just disappearing into a black hole.
The Application is Your First Handshake
Ever wonder why you get so many half-finished applications? A low Application Completion Rate is a giant, flashing red sign that your process is actively hostile to good candidates. If applying for a job at your company feels like doing your taxes, you’ve already lost.
The best people are busy. They won't spend 45 minutes re-typing their entire resume into clunky form fields. They have other options.
Your application process is the front door to your company. If it’s locked, complicated, or just plain annoying, the best candidates won’t bother knocking. They’ll just walk over to your competitor’s house.
This metric is simple: track the number of people who start an application versus the number who actually finish it. If more than 20% are dropping off, you have a serious problem. It’s time to brutally simplify your process before you do anything else.
Are You Fishing in the Right Ponds?
Next up is Sourcing Channel Effectiveness. This is where you stop guessing and start measuring where your best hires actually come from. Spoiler: it's probably not where you’re spending the most money.
Most companies throw cash at big job boards and recruiting agencies because it feels productive. But are those channels delivering people who get hired, stick around, and perform well? Or are they just sending you a high volume of noise?
You need to track every single hire back to their original source. Was it a referral? A LinkedIn search? A niche community? This isn't just about volume; it’s about quality.
Here’s a practical way to think about it:
- Referrals: Often the highest quality source. Hires tend to onboard faster and stay longer.
- LinkedIn/Direct Sourcing: Great for finding passive candidates who aren’t actively looking but are a perfect fit.
- Job Boards: Can be a numbers game. You might get a high volume of applicants, but the signal-to-noise ratio can be painfully low.
- Agencies: Can be a lifesaver for specific, hard-to-fill roles, but the cost demands you track their success rate ruthlessly.
Once you have this data, the path forward becomes crystal clear. Double down on the channels that deliver high-performers and cut the dead weight. Exploring different candidate sourcing strategies based on real data, not just habit, is how you stop wasting your budget.
The Final Hurdle: Offer Acceptance Rate
You’ve done it. You found the perfect candidate, they navigated your interview gauntlet, and the team loves them. You send out the offer, pop the champagne, and then… crickets. They reject it.
Your Offer Acceptance Rate (OAR) is the ultimate pass/fail grade for your entire recruitment process. A low OAR (anything below 85% is a warning sign) tells you there’s a massive disconnect between the story you’re selling and the reality you’re offering.
A rejection isn’t just a disappointment; it’s an expensive lesson. It means you just wasted dozens of hours of your team’s time and have to start the entire search over again. This KPI forces you to ask the hard questions. Was your compensation off? Did your culture seem toxic during interviews? Was the hiring manager a jerk?
Fixing a leaky funnel isn't about finding more applicants. It's about respecting the ones you have.
How to Build a Dashboard That Drives Action
Let’s get one thing straight: a dashboard full of colorful charts that nobody understands is just digital clutter. It's the corporate equivalent of that treadmill in your basement that's currently being used as a laundry rack. It looks productive, but it’s accomplishing nothing.
The real goal of tracking recruitment KPIs isn't to present more data; it's to present the right data. You want to spark a conversation, force a decision, and ultimately, drive action. Your dashboard should be your one-page command center, not a final exam in data science.
You don't need some ridiculously expensive business intelligence tool to get this done, either. Honestly, you can build a killer dashboard with tools you already have, like Google Sheets or the reporting module in your Applicant Tracking System (ATS). The magic isn't in the software; it's in the focus.
From Data Points to Story Points
Every single metric on your dashboard needs to answer the question, "So what?" If a C-level exec glances at your dashboard for 30 seconds, they should walk away knowing exactly where your hiring process is winning and where it’s on fire. Each chart should tell a simple story.
Think about how you can frame your core KPIs to be more than just numbers:
- Cost Per Hire: Don't just show a single figure. Show it as a trend line moving up or down over the last six months. Better yet, plot it against the departmental budget to show its real-world impact. Now it's not just a number; it's a story about financial discipline.
- Time to Hire: Break this beast down by role or department. If it takes you 15 days to hire a marketer but 75 days to hire an engineer, that’s not just a data point—it's a massive, blinking sign pointing to a specific bottleneck in your tech recruiting process.
- Quality of Hire: This one is huge. Track it as an average score, quarter over quarter. A rising score is the ultimate proof that your process isn't just fast and cheap, but that it's actually getting smarter. Toot, toot! This is how you prove your value.
Keep It Simple, Seriously
Your dashboard should be ruthlessly simple. I’m a big fan of the "Rule of 5-7." Never, ever put more than five to seven core KPIs on your primary dashboard. Any more than that, and you're just creating noise.
A great KPI dashboard doesn't answer every question. It prompts the right ones. Its purpose is to start a strategic conversation, not end it with an avalanche of data.
You'll know it's working when people look at your dashboard and immediately ask, "Why is our offer acceptance rate dropping?" or "What's driving the success in the sales team's hiring?" The dashboard is the headline; the deep dive comes next.
The Essential One-Page Command Center
So, what should actually be on this magical one-page dashboard? If I were forced to build one from scratch today, these are the non-negotiables I’d include.
Your Dashboard Must-Haves
| KPI Category | The Specific Metric to Track | The "So What?" It Answers |
|---|---|---|
| Speed | Time to Hire (by department) | "Are we moving fast enough to land top talent, or are our processes a bottleneck?" |
| Cost | Cost Per Hire (trended over time) | "Is our recruiting spend efficient, or are costs spiraling out of control?" |
| Quality | Quality of Hire (average score) | "Are we actually hiring people who succeed and add value long-term?" |
| Funnel Health | Offer Acceptance Rate | "Is our offer compelling, and is our candidate experience closing the deal?" |
| Sourcing | Source of Hire (by quality) | "Where do our best hires really come from, and where should we invest our budget?" |
That’s it. Five metrics. That's all you need to get started. This isn't about building the world's most complex analytics machine. It’s about building a simple tool that helps you and your leadership team make smarter, faster, and more data-informed decisions about your most important asset: your people.
Stop admiring the data and start acting on it.
Turning Your Recruitment Data into a Competitive Edge
Tracking your recruiting KPIs is pointless if you don’t actually do anything with the information. Data is a diagnostic tool, not a trophy to hang on the wall. The real work begins after you’ve built the dashboard—this is where you turn those numbers and trend lines into a genuine competitive advantage.
So, your Time to Hire is embarrassingly long. Now what? Just staring at the chart won't fix it. The goal is to take that insight and turn it into immediate, targeted action. You want to build a culture where your recruiting process gets smarter with every single hire, not just once a year when you're reviewing the budget.
From Diagnosis to Action
Forget about massive, year-long strategic overhauls. Real, lasting improvement comes from small, consistent tweaks. When one of your KPIs is flashing red, don’t just schedule another meeting to talk about it. Instead, use this simple, no-nonsense framework to force a change.
Tracking data without taking action is just a very expensive hobby. The point isn’t to know the score; it’s to change the game.
Let’s say your Offer Acceptance Rate has dropped to a dismal 70%. You’re losing nearly one out of every three candidates you desperately want to hire. It's time to act.
-
Identify the Problem KPI: Don’t try to fix everything at once. Zero in on the one metric that’s causing the most pain right now. In this case, it's that sinking Offer Acceptance Rate.
-
Diagnose the Root Cause: Get the right people in a room—the recruiter, the hiring manager, maybe even someone who recently accepted an offer. Was the compensation off? Did the final interview feel disorganized and chaotic? Dig for the real "why" behind those rejections.
-
Implement One Small Change: Don't try to redesign your entire compensation philosophy overnight. Instead, make one small, measurable change. For example, you could start explicitly discussing salary expectations during the very first screening call to eliminate any nasty surprises down the line.
-
Measure the Result: Now, track your OAR for the next five offers you make. Did the number tick up? If it did, you’ve found a fix you can scale. If not, it’s time to try the next small change on your list.
This iterative process—Identify, Diagnose, Implement, Measure—is exactly how you build a truly agile and responsive recruiting function. You stop guessing what candidates want and start using your own data to build a process that top talent can't refuse. Your KPIs for recruitment are no longer just numbers; they’re your playbook for winning.
A Few Final Questions on Recruitment KPIs
Alright, you've made it this far, which means you're serious about getting your recruitment metrics in order. Let's tackle a few common questions that always seem to pop up when founders and hiring managers start digging into their KPIs. No fluff, just straight answers.
Which KPI for Recruitment Should I Track First?
If you can only track one thing, start with Time to Hire. Seriously.
It's the easiest to measure—just count the days from when a candidate first applies to when they sign their offer letter. But more importantly, it has a massive ripple effect on everything else. A long Time to Hire frustrates your team, leaves critical roles empty, and gives your best candidates a golden opportunity to accept an offer from someone else.
Fixing this one metric forces you to look at every part of your process, from screening to scheduling. Get this number down, and you'll almost always improve the candidate experience and even lower your Cost Per Hire as a side effect.
How Often Should I Review My Hiring Metrics?
Don't go overboard. For most companies, a monthly review hits the sweet spot. It's frequent enough to spot a negative trend before it completely torpedoes your quarter, but not so often that you're panicking over tiny, meaningless blips in the data.
The real key here is to review them with your hiring managers and leadership. A dashboard nobody looks at is just a waste of pixels. Make it a team sport so everyone understands what the numbers are telling you and can agree on what to do next.
Is My Applicant Tracking System Reporting Good Enough?
Honestly? Probably not. An Applicant Tracking System (ATS) is fantastic at tracking activity—how many people applied, who’s in what stage, and so on. Think of it as a digital filing cabinet. It’s great for that.
But it rarely tells you anything about outcomes. Your ATS tells you that you hired someone, but it can't tell you if you hired the right someone. That’s where a metric like Quality of Hire comes in, and your ATS alone can't calculate that. We’re not saying we’re perfect. Just more accurate more often.
Use your system for the raw data, but you have to be the one to connect it to performance reviews and business results to get the full story. The best recruitment KPIs link hiring activity to actual business impact, and that’s something a default ATS report just can't do on its own.
Ready to stop guessing and start hiring smarter? Async Interview helps you screen candidates up to 10x faster, so you can focus on what matters: finding the right people. Ditch the scheduling headaches and see for yourself how asynchronous video interviews can transform your process. Start your free trial today.